Global score
Which method should produce the single dashboard score and screening bands?
A concise comparison of candidate methods for reporting 2026 Beginning-of-Year early numeracy screener performance, with provisional judgements organised around subtest representation, precision and uncertainty, and classification stability.
This memo compares scoring methods for two decisions: the single global BOY score and the student-level subtest scores. The immediate reporting need is one global score for dashboard labels and bands, plus a defensible way to describe subtest profiles.
The longer-term direction is a two-axis accuracy × pace report, but that architecture is not the immediate BOY single-score decision.
Which method should produce the single dashboard score and screening bands?
Which method should produce student profiles by subtest?
| Method | Description | Subtest representation | Precision / uncertainty | Classification stability |
|---|---|---|---|---|
| All-items timed-performance IRT | Unidimensional + testlet model. One global score from all retained items. Timed subtests use timed-performance scoring. | Uses all included items, but longer subtests naturally carry more influence. | Model-based uncertainty is available where posterior summaries or SEs are exported. | Current benchmark for movement checks. Stability must be read against challengers, not assumed as validity. |
| Equal-subtest timed-performance IRT | One global IRT score, with item contributions weighted so each subtest has equal design influence. | Balances all five subtests by design. | Modelled uncertainty is available, but equal weighting is a deliberate design choice. | Compare against all-items timed-performance IRT using percentile movement and high-concern cut-point crossings. |
| Hierarchical global-plus-subtest timed-performance model | Joint model estimating a general score plus subtest-specific deviations. | Represents all subtests and explicitly models subtest profiles. | Strong for shrinkage and posterior uncertainty. | Compared with all-items timed-performance IRT, the global score can move students materially. Global use needs explicit justification. |
| Equal-subtest raw-score composite | Each subtest is scored directly from responses, then standardised and averaged equally. | Transparent equal-subtest representation. | Simple and auditable, but weak on uncertainty and item difficulty. | Useful as a sanity check, not a strong standalone psychometric endpoint. |
| Selected-subtest reliability-weighted marker | Separate subtest calibrations. A selected subset feeds the global ability marker, weighted by reliability. Pace/fluency is separate. | Only selected subtests contribute to global ability. That selection is a major construct decision. | Reliability-aware, but reliability is not the same as construct usefulness or validity. | The deck reviewed appears to use a 2025 cohort base. Run a 2026 comparison before treating it as a BOY scoring option. |
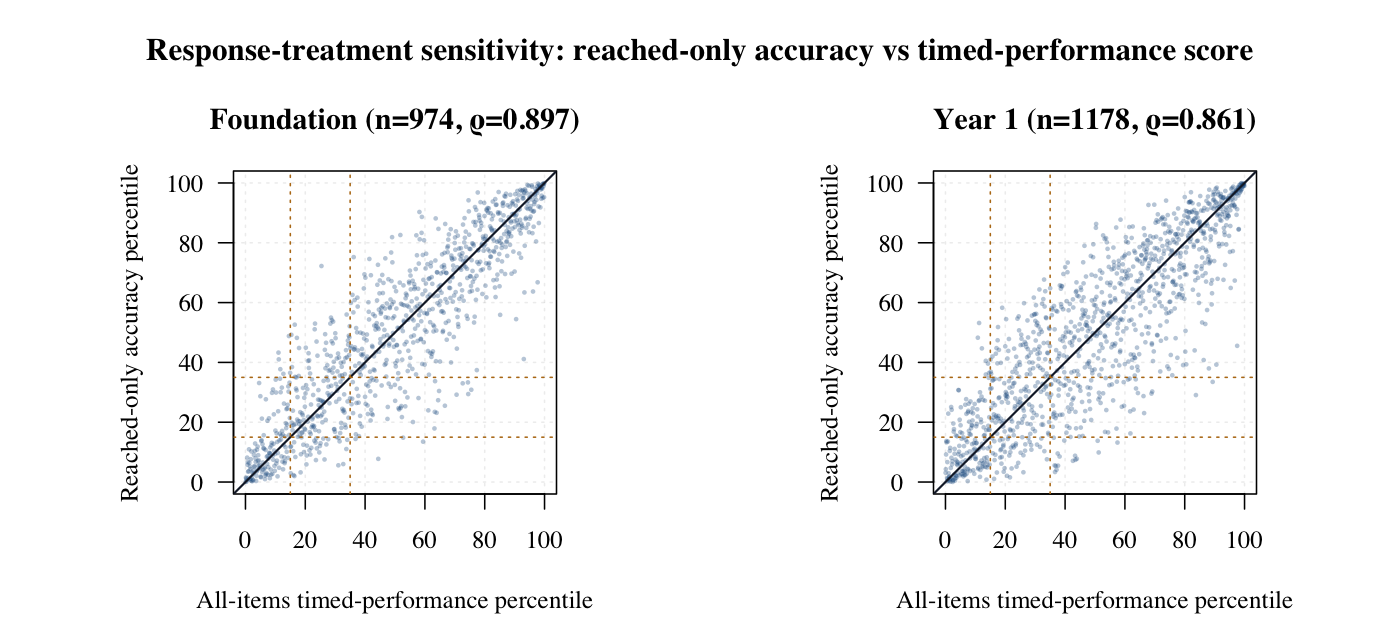
Reached-only accuracy versus timed-performance scoring. This shows how much the global score depends on treating trailing unreached timed items as zero credit.
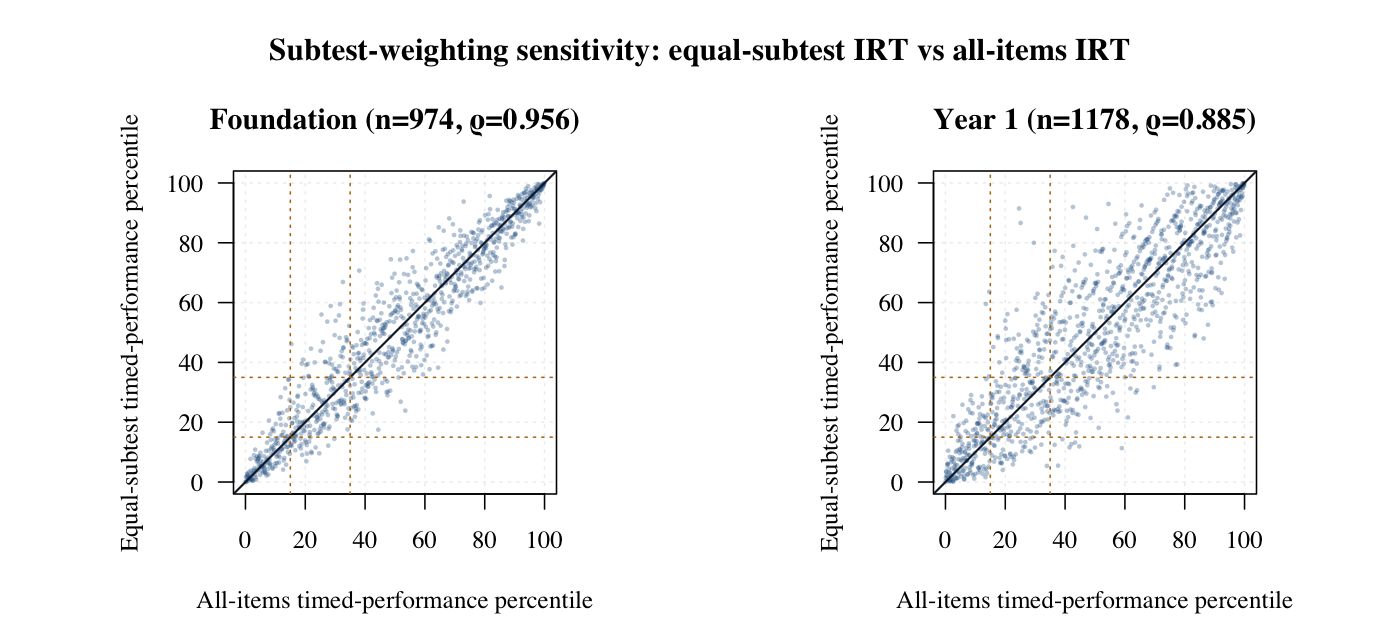
Equal-subtest timed-performance IRT versus all-items timed-performance IRT. This shows whether unequal subtest lengths materially affect student ordering.
| Method | Description | Subtest representation | Precision / uncertainty | Classification stability |
|---|---|---|---|---|
| Standalone subtest IRT | Each subtest is modelled separately. Timed subtests use timed-performance inputs where applicable. | Clean subtest-specific score for each probe. | Provides subtest model scores and SEs, but does not borrow information across subtests. | Compare directly against hierarchical subtest scores by same student ID. |
| Hierarchical modelled subtest scores | Subtest scores are estimated inside the joint model as general level plus subtest-specific deviation. | Represents all subtests while modelling each student’s profile. | Strong for shrinkage and posterior uncertainty, especially for shorter or noisier subtests. | May shift subtest interpretation relative to standalone IRT. Needs same-student agreement review. |
| Raw/proportion subtest scores | Direct score from responses, such as correct over denominator or reached accuracy. | Highly transparent for teachers and audit. | No item-difficulty adjustment or modelled uncertainty. | Useful companion method, but should not be the only evidence for subtest bands. |
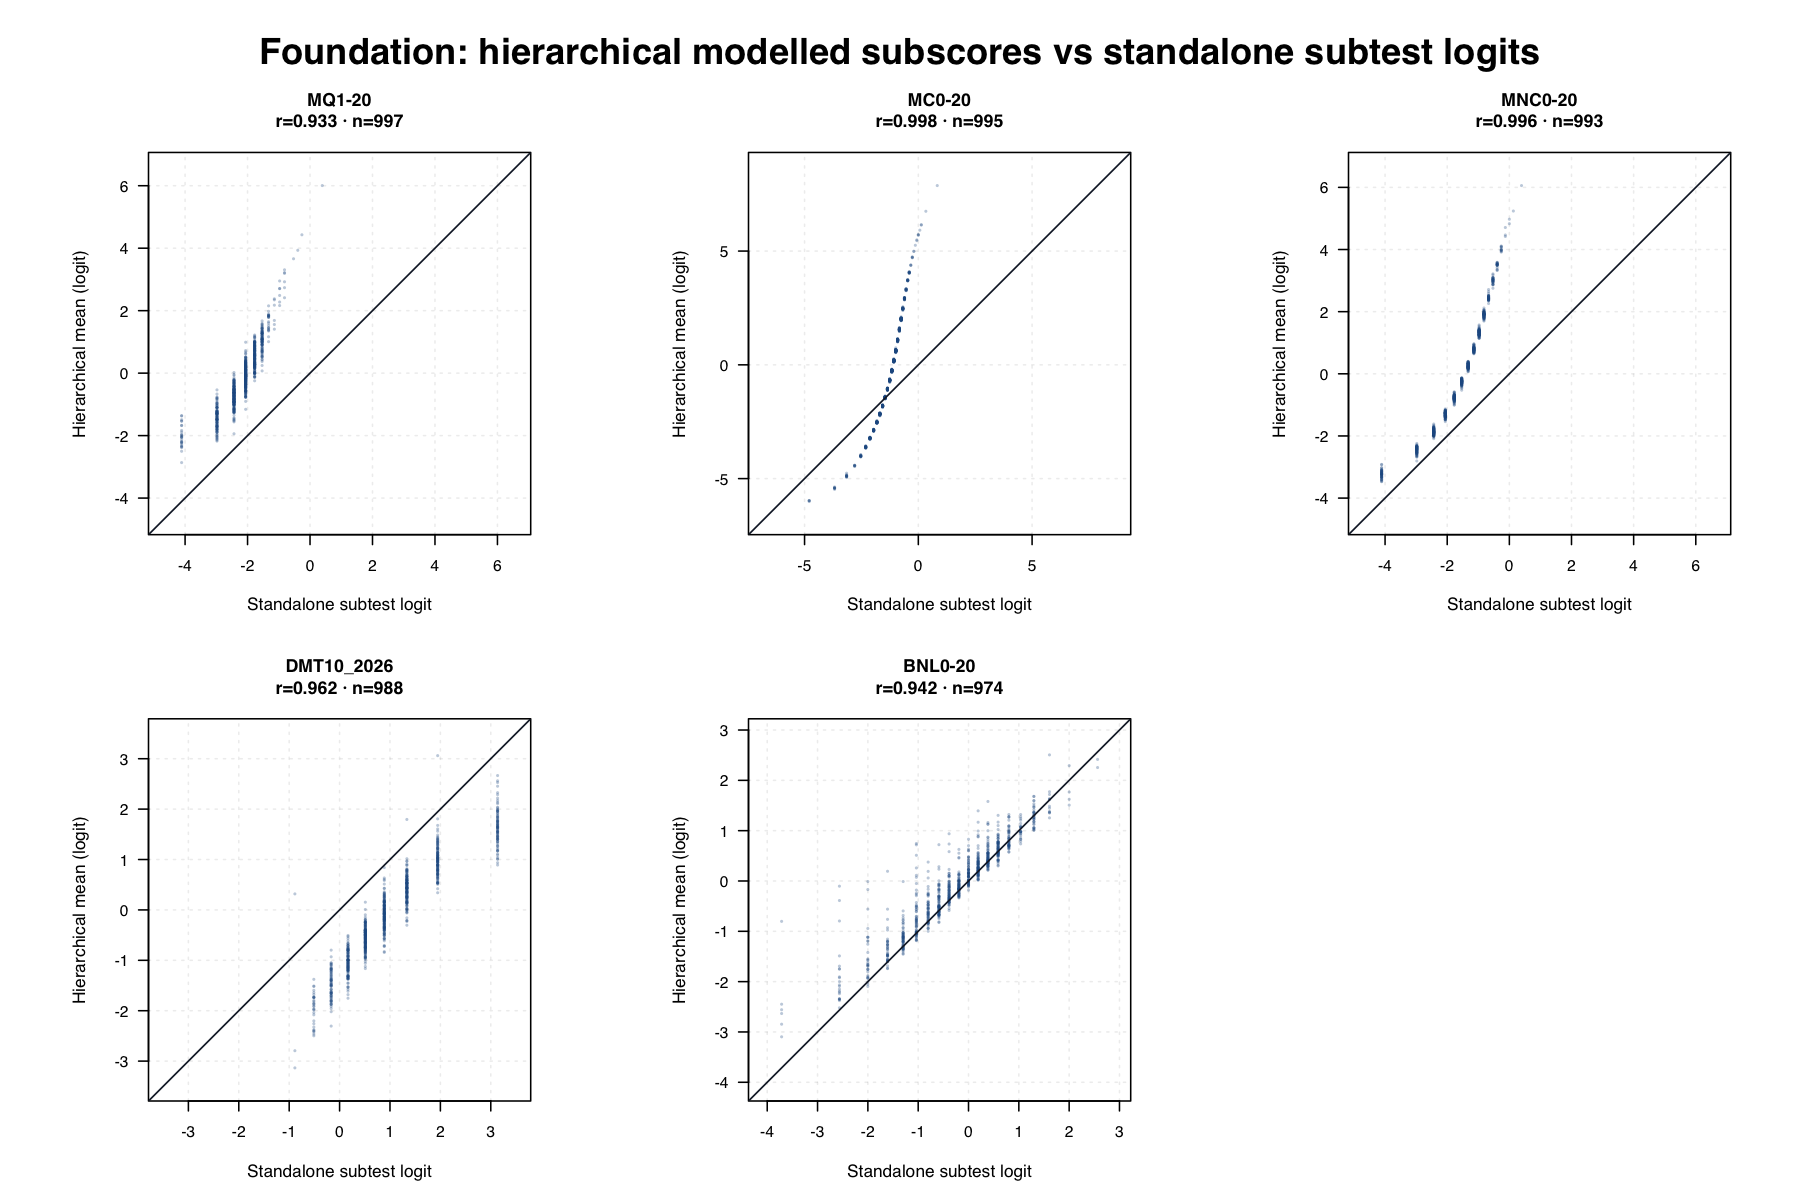
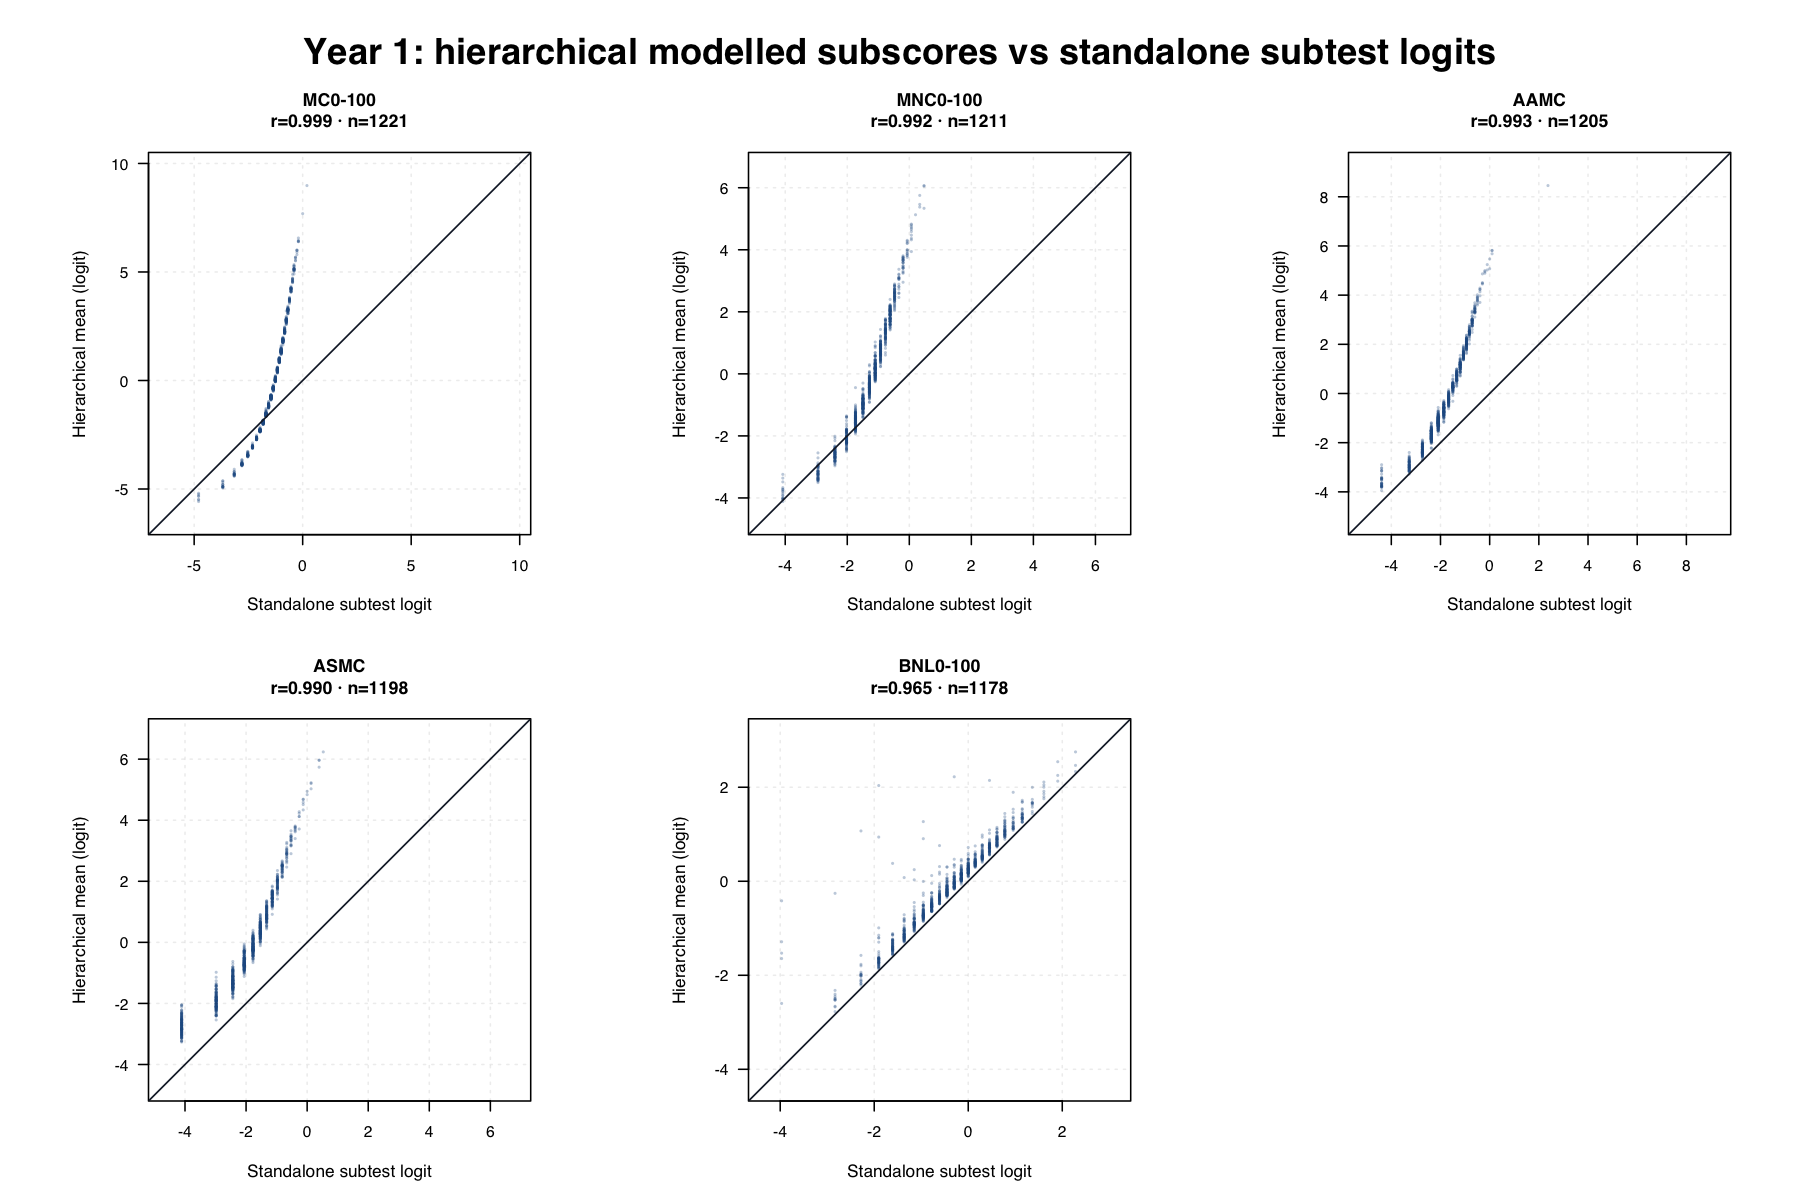
Hierarchical modelled subtest logits versus standalone subtest IRT logits. Each dot is the same student ID. The black line is equality; the red line is the fitted trend.
Score what students answered correctly among valid reached responses. Cleaner as an accuracy or ability claim, but can understate timed productivity concerns.
Trailing unreached items receive zero credit. This intentionally blends accuracy, reach, pace and productivity.
Report accuracy and pace separately. Conceptually cleaner, but not the immediate BOY single-score decision.
Notation: student i, item j, subtest s(j), testlet t(j), scored response y. Equations below are schematic, intended to document the scoring architecture rather than every implementation detail.
Each retained item contributes once. For timed subtests, y uses timed-performance scoring.
The item model is similar, but likelihood contributions are weighted so subtests have equal design influence.
The model estimates a general score and subtest-specific deviations. Subtest scores are posterior summaries of θ_i,s.
This is direct observed scoring, not an IRT model.
Only selected subtests enter the global ability marker. Reliability weights r_s affect influence, but do not by themselves define construct importance.
Valid reached responses are scored 0/1. Trailing unreached items receive zero credit. Intermittent, contract, QC or other non-comparable missing rows remain missing.
Reliability can inform precision, uncertainty, shrinkage and reportability. It should not automatically determine construct importance. A reliable subtest can be narrow or misaligned; a noisier subtest can still represent an important domain.
The global sensitivity plots use release-candidate comparison exports. The subtest agreement plots join standalone TAM person scores to hierarchical subtest posterior means by year level, subtest and same student GUID.